Interactive R Tutorials
Our free self-paced R training series for public health
Interactive R Tutorials
Outline
Our free self-paced R tutorial series
Access
To access these tutorials, simply create a free Applied Epi account and click the tutorial link below. You do not need to install R to use the tutorials.
Target audience
Public health practitioners, epidemiologists, clinicians, and researchers who cannot access our live courses.All of our training materials focus on challenges and solutions for frontline practitioners, are accessible to beginner audiences, and are built by our team with extensive ground-level experience. Read more about our educational approach.
Format
You code in R interactively within the tutorial window - there is no need to install R.

Our partners
Supportive funding for these tutorials was provided by Médecins Sans Frontières (MSF) / Doctors without Borders and TEPHINET.
Self-paced tutorials
If you have an Applied Epi Account and a tutorial still does not load, please try again later. The volume of users may exceed capacity.
If you find these tutorials useful, please consider supporting us so that we can maintain and expand free resources like this.
R Basics
Click here to access this tutorial with your free Applied Epi account.
The R basics tutorial introduces you to R and RStudio, explains why R is increasingly popular in public, and walks you through a series of coding exercises to learn basic R commands.
Using interactive R interfaces and public health examples you learn how to storing and reference objects in R, our recommended approach for installing and loading R packages, file and project organization best practices, how to import data, and how to review an imported dataset.
Data preparation
Click here to access this tutorial with your free Applied Epi account.
The Data preparation tutorial covers what you need to know about organizing your data before importing it into R, so that it will be easy to handle and analyze.
We cover the principles of "tidy data", dive into the differences between data that is optimized for "human-readability" as compared to "machine-readability", discuss data collection, and touch upon data dictionaries.
Data cleaning
Click here to access this tutorial with your free Applied Epi account. It may take some time to load.
The Data cleaning tutorial introduces you to essential R functions for data management by building a classic public health data cleaning pipeline step-by-step.
Using interactive R interfaces, you inspect a case linelist and run important data cleaning commands such as cleaning column names, selecting and re-ordering columns, de-duplicating rows, cleaning incorrect values, creating categorical age groups, re-coding values with simple and complex logic statements, prioritizing certain values, and filtering rows based on logical criteria.
All of the commands and techniques taught here are easily transferrable to other types of public health data sets (not only case linelists).
Basics of data visualization in R
Click here to access this tutorial with your free Applied Epi account. It may take some time to load.
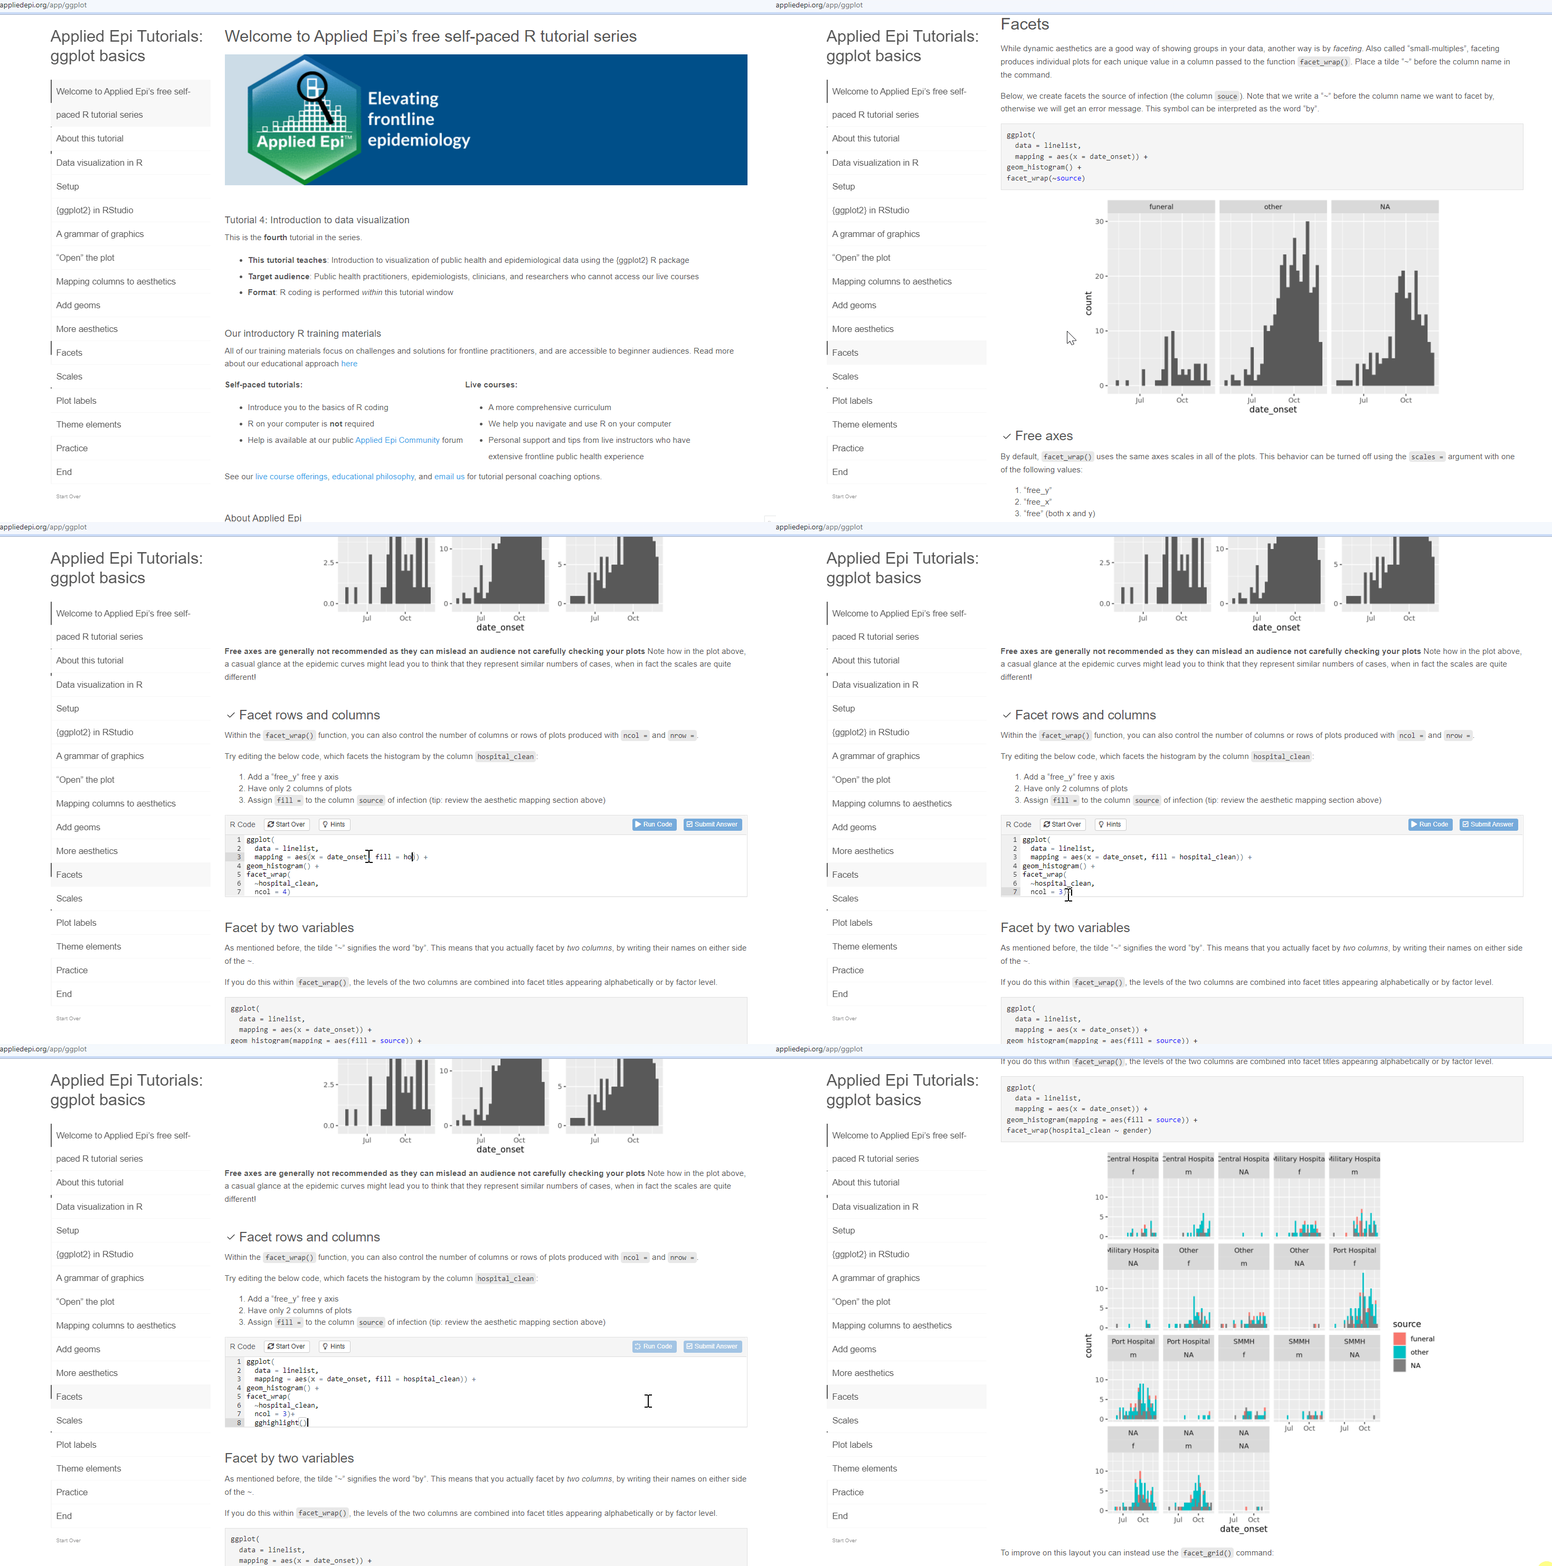
The Basics of data visualization tutorial introduces you to the {ggplot2} R package and helps you practice building visualizations of public health data.
Using the case linelist, you learn the "grammar of graphics" syntax of {ggplot2} and use it to build a variety of bar, scatter, boxplot, and line plots, histograms, and leverage R's incredible versatility to achieve exactly the colors, axis scales, layout, and specifications that you want.
You are also introduced to intermediate plotting techniques, such as having plot text labels that automatically update when your dataset is refreshed.
Summary tables
Click here to access this tutorial with your free Applied Epi account. It may take some time to load.
This tutorial covers three ways to make summary tables of public health data in R: quick and simple tables with the {janitor} package, custom tables with the {dplyr} package, and publication-ready tables with the {gtsummary} package. Prepare your tables for readers with the {flextable} package as well.
Contributors
- Neale Batra
- Brianna Bradley
- Arran Hamlet
- David Jorgensen
- Mara Kont
- Alex Spina
License
 Applied Epi Incorporated, 2022
This work is licensed by Applied Epi Incorporated under a Creative Commons Attribution-NonCommercial-ShareAlike 4.0 International License